
EV Bus

Entry posted by Bruce551 ·
354 views
 Testing Finds Proterra Electric Transit Bus Achieves More Than 20 mpg Diesel Equivalent
5 May 2009
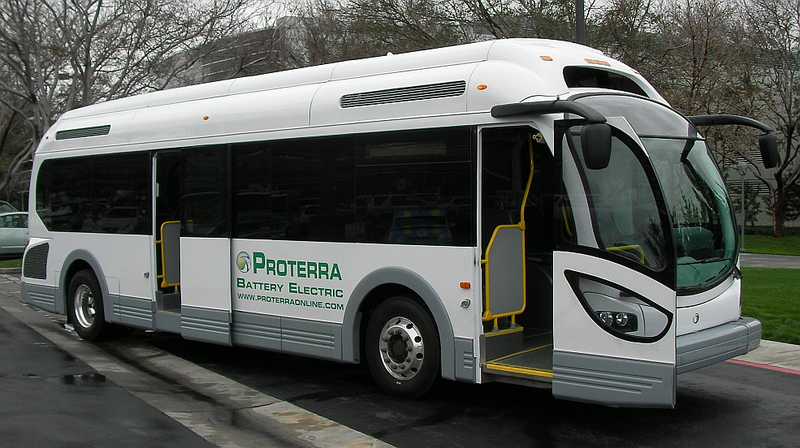
Proterra battery-electric bus. An all-electric version of the 35-foot Proterra FCBE 35 transit bus, powered by a UQM PowerPhase 150 electric propulsion system and an Altairnano Li-ion battery pack (earlier post), achieved more than 20 miles per gallon diesel equivalent in fuel economy equivalency testing conducted by the Pennsylvania Transportation Institute at Pennsylvania State University.
Testing of the composite body all-electric version of the FCBE 35 transit bus was conducted using a modified Transit Coach Operating Duty Cycle (ADB) that includes simulated central business district, arterial and commuter operations.
Calculated diesel equivalent fuel economy for each phase was: 21.35 mpg on the central business district phase, 17.55 mpg on the arterial phase and 29.23 mpg on the commuter phase. Each test phase simulated transit-type service at seated load weight and included various passenger pickup stops.
Simulated test phases ranged from 7 stops per mile and a top speed of 20 mph during the central business district phase to 1 stop and a top speed of 40 mph during the commuter phase. The FCBE 35 transit bus was tested at a gross vehicle weight of 36,680 based on a seating capacity of 38 passengers, including the driver and 34 standing passengers.
Fuel economy testing was conducted with the air conditioning system turned off. Air conditioned operations are expected to reduce fuel economy results by approximately 30%. The bus was recharged in less than 20 minutes using the Proterra’s TerraVolt fast charge energy storage system at the end of each completed ADB, replenishing the energy consumed and thereby extending the total daily vehicle range.
The UQM electric propulsion system produces peak torque of 650 N·m and peak power of 150 kW (201 hp). The system has a continuous torque rating of 400 N·m and a continuous power rating of 100 kW (134 hp). The system also features optimized four-quadrant performance, dynamic torque, speed and voltage control, regenerative braking and system energy efficiency of more than 90% across substantially all of its performance regimen.
The test validated that Proterra’s 35-foot transit bus achieves up to 400 percent better performance than today’s conventional diesel or competitor’s hybrid transit buses. These fuel economy improvements together with the ability to extend total daily vehicle range through our TerraVolt rapid charge capability offers a tremendous advantage to transit operators who are looking to reduce both emissions and vehicle operating costs.And charge the Proterra EV Bus with PV roof-top.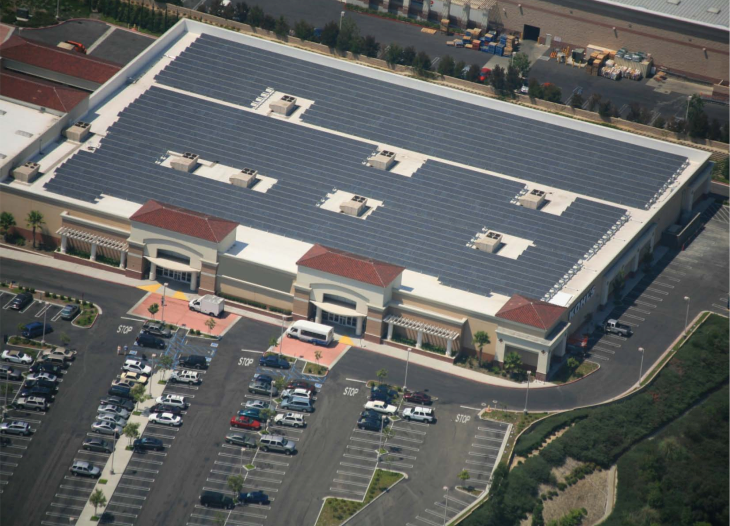 The Proterra EV Bus could transform Chiang Mai's cronic air pollution problem, solve traffic congestion, improve the quality of life, and enhance the tourism business. This is the least cost option compare tearing up the streets and making Chiang Mai really ugly.A little bit about Roof-top PV in the USA.
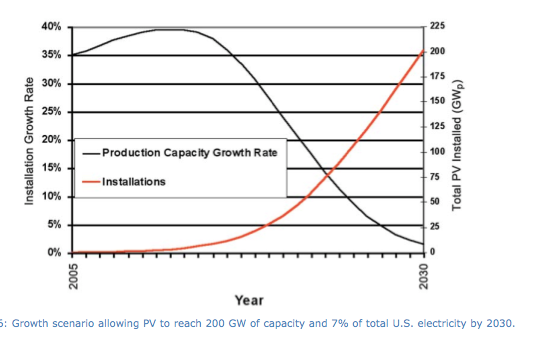 Rooftop and Land Availability for PV
PV can be deployed on rooftops or in ground-based distributed and utility-scale applica-tions. Rooftop deployment has the advantage of incurring zero land use costs, although opportunity costs are not necessarily zero when competing with other solar technologies (water heating, daylighting) or other uses such as green roofs. A significant advantage of rooftop deployment is the minimal transmission and distribution (T&D) requirements (and losses), because most of the energy is used at the point of generation.
The rooftop area, and therefore potential space for PV in the United States, is very large. Two previous estimates of the total available roof space for PV in the United States are 6 and 10 bil- lion square meters, even after eliminating 35% to 80% of the total roof space due to shading and inappropriate orientation [6,7]. The lower value also does not include certain industrial and agricultural buildings. While fairly rough estimates, these values provide some idea of the poten- tial resource base.
Assuming a typical PV system performance of 100 watts per square meter (W/m2) (equivalent to an average insolation of 1000 W/m2and a 10% AC system efficiency), this rooftop area represents a potential installed capacity of 600 to 1000 GW. At an average capacity factor of 17%, this installed capacity could provide 900-1500 terawatt-hours (TWh) annually. This represents about 25% to 40% of the total U.S. electricity consumption in 2004.
If building area grows at the same rate as electricity consumption, this PV potential (in terms of fractional energy supply) will remain constant. However, because the efficiency of PV modules is expected to substantially increase over time, the PV potential on rooftops could also increase. In addition, this rooftop potential does not consider parking structures or awnings or south-facing building facades.
Beyond rooftops, there are, of course, many opportunities for PV on low (or zero) opportunity cost land such as airports (which have the added advantage of being secure environments), and farmland set-asides. Land-based solar PV may be deployed in “tracking” arrays, which could increase the annual output by 25% or more, and decrease the amount of land required.
This preliminary assessment indicates that non-zero-cost land set aside specifically for solar PV generation will not need to occur until this technology provides a very large fraction (perhaps more than 25%) of the nation’s electricity.
In the scenario we evaluated here, in which 200 GW of solar PV provides about 7% of the nation’s electricity, PV is unlikely to be burdened by constraints of intermittency, transmis- sion requirements, land use, or materials supplies.
Available roof space (and zero- to low- cost land) and known materials can provide resources far beyond this level of PV use. In the long term, at some point beyond this level of penetration, intermittency poses a more ignificant challenge, likely requiring large-scale deployment of a viable storage technolo-gy. However, as part of a diverse mix of renewable energy technologies, solar PV by itself can play a valuable role in reducing carbon emissions from the electric power sector.
Industry – By the Numbers $1,045 billion in revenue from renewable energy & energy efficiency industries in U.S. (ASES 2007)
$160 billion in tax revenue generated in U.S. (federal, state, local) by renewable energy & energy efficiency industries (ASES 2007)
9 million jobs from renewable energy & energy efficiency industries in U.S. (ASES 2007)
259 megawatt photovoltaic market in U.S. in 2007; estimated to grow to 1,590 megawatts by 2010; was only 17 megawatts in 2000 (Prometheus Institute for Sustainable Development)
60% of the world’s energy to be from renewable sources by 2060 (Shell International)Download Link: Tackling Climate Change in the U.S.: Potential Carbon Emissions Reduction from Energy Efficiency and Renewable Energy, PDF http://ases.org/images/stories/file/ASES/climate_change.pdfAmerica Solar Energy Society
Wish everyone a nice weekend with some sunshine ![]()
7 Comments
Recommended Comments
Please sign in to comment
You will be able to leave a comment after signing in
Sign In Now